
Why I Wrote This
In a time of headlines, hashtags, and political noise, it’s easy to get swept up in narratives — but harder to sit with the facts. I wrote this piece not to fan flames or pick sides, but to take a clear-eyed, objective look at the recently passed FY2025 budget resolution. I wanted to understand what’s really inside it — beyond the soundbites — and how its provisions ripple through our economy, our communities, and our homes.
Budget resolutions may seem abstract, but they shape real lives. Who gains? Who loses? What gets prioritized, and what gets cut? My goal was to break it all down — from tax policy to healthcare, from the middle class to the margins — and assess what this budget blueprint means for Americans of all backgrounds: rich, poor, urban, rural, single, married, Black, white, Latino, and everyone in between.
This isn’t about ideology. It’s about impact. It’s about understanding — and holding space for the hard questions our country needs to face.
Introduction: House Concurrent Resolution 14 (119th Congress) is the adopted congressional budget framework for Fiscal Year 2025, setting revenue and spending targets for 2025–2034. While budget resolutions are nonbinding and do not appropriate actual funds, they lay the groundwork for subsequent legislation (especially via reconciliation) to enact tax and spending changes. H.Con.Res. 14, passed with narrow support in early 2025, reflects a policy agenda of significant tax cuts alongside deep reductions to federal safety net programs. Key elements include extending the 2017 Tax Cuts and Jobs Act (TCJA) provisions at a ten-year cost of roughly $4.5 trillion, and instructing committees to propose over $1 trillion in mandatory spending cuts – notably around $880 billion from health programs (likely Medicaid) and $230 billion from nutrition assistance (SNAP) – as partial offsets. This analysis reviews the resolution’s major provisions and their projected impacts, especially on middle-class and lower-income Americans. Each section also outlines evidence-based alternative policies that experts suggest would better support broadly shared prosperity and fiscal sustainability. The report maintains a nonpartisan, policy-analysis tone, using data from credible sources to compare the resolution’s approach with potential alternatives.
Extension of 2017 Tax Cuts and Revenue Effects
Resolution Proposal: The budget resolution’s centerpiece on the revenue side is a permanent extension of the individual and estate tax cuts from the 2017 Tax Cuts and Jobs Act (TCJA), along with business tax provisions such as 100% bonus depreciation. Under current law, many of the TCJA’s tax cuts are set to expire after 2025. H.Con.Res. 14 assumes these cuts are extended through 2034, adding an estimated $4.5 trillion to the federal debt over the next decade. The rationale given is to prevent tax increases and ostensibly spur economic growth. However, analysis of the distributional effects shows that the largest benefits of extending the TCJA would flow to high-income households, while providing relatively modest tax relief to middle- and low-income families. For example, the top 1% of earners (incomes above roughly $650,000) would enjoy an average tax cut of around 3% of their income (tens of thousands of dollars per year), whereas households in the bottom 40% might see only a fraction of a percent increase in after-tax income. Historical evidence from the TCJA’s first years indicated that wealthy individuals and corporations received disproportionate gains, with limited “trickle-down” to workers’ wages or broader investment. Moreover, if these tax cuts are deficit-financed (as the resolution allows), the added government borrowing is projected to crowd out private investment and raise interest rates over time, offsetting short-term growth. The Congressional Budget Office (CBO) has noted that a permanent deficit-financed tax cut can reduce long-run GDP by increasing debt. In short, the resolution’s tax policy would double down on the 2017 law’s regressive profile: giving the biggest dollar benefits to the wealthy, while leaving little direct benefit for middle-class and low-income households.
Evidence-Based Alternatives – Tax Policy to Support Broadly Shared Growth: Rather than extending costly tax cuts that chiefly benefit the top, a number of alternative tax policies are supported by research to aid middle- and lower-income Americans more effectively:
Targeted Tax Credits for Workers and Families: Expanding and strengthening tax credits like the Earned Income Tax Credit (EITC) and Child Tax Credit (CTC) has been shown to boost incomes at the bottom and encourage work. For example, the temporary CTC expansion in 2021 significantly reduced child poverty. Making such expansions permanent or increasing the EITC for childless workers would provide direct support to low-wage workers and families in need, with positive long-term outcomes (improved health, educational attainment, etc.). Unlike top-heavy tax cuts, these credits put money in the pockets of those likely to spend it, stimulating local economies.
Retaining Progressive Tax Elements: Allowing the 2017 tax cuts to expire for high-income households (as scheduled under current law) would raise substantial revenue from those with greatest ability to pay, while having minimal impact on middle-class tax levels. The Joint Committee on Taxation’s analyses indicate that reverting the top marginal rate and estate tax parameters to pre-2017 law would predominantly affect the very wealthy, reducing after-tax inequality without harming middle-earners. This revenue could be redirected to investments benefiting broad groups (education, infrastructure, or deficit reduction as needed).
Closing Tax Loopholes and Adjusting Corporate Taxes: Evidence-based reforms include closing loopholes that allow tax avoidance by multinational corporations or ultra-wealthy investors. For instance, tightening rules on offshore profit shifting or taxing capital gains at death (eliminating the stepped-up basis) are policies that nonpartisan experts (including Treasury and academic economists) have long recommended to improve fairness and raise revenue. Similarly, restoring a slightly higher corporate tax rate (the TCJA cut the rate from 35% to 21%; even a partial rollback to around 25-28% as some bipartisan plans have suggested) could raise revenue from profitable corporations with minimal effect on domestic investment (research shows factors like infrastructure and consumer demand are more important for investment decisions than a few percentage points of tax rate).
Avoiding Deficit-Financed Tax Cuts for the Wealthy: A key finding from CBO and other modelers is that deficit-financed tax cuts yield less economic growth than balanced fiscal approaches. By foregoing new unfunded tax cuts largely for upper incomes, policymakers can avoid accelerating the national debt. In fact, evidence from the 1990s fiscal deals and 2013’s fiscal cliff resolution suggests that a mix of targeted spending and revenue increases on high-earners can reduce deficits without undercutting economic growth. Thus, an alternative budget strategy would focus any tax relief on middle and low earners (who are likely to spend it), while offsetting costs by phasing out tax breaks that mainly benefit the rich. This approach would better support broad-based growth and fiscal health than the regressive tax cuts envisioned in H.Con.Res. 14.
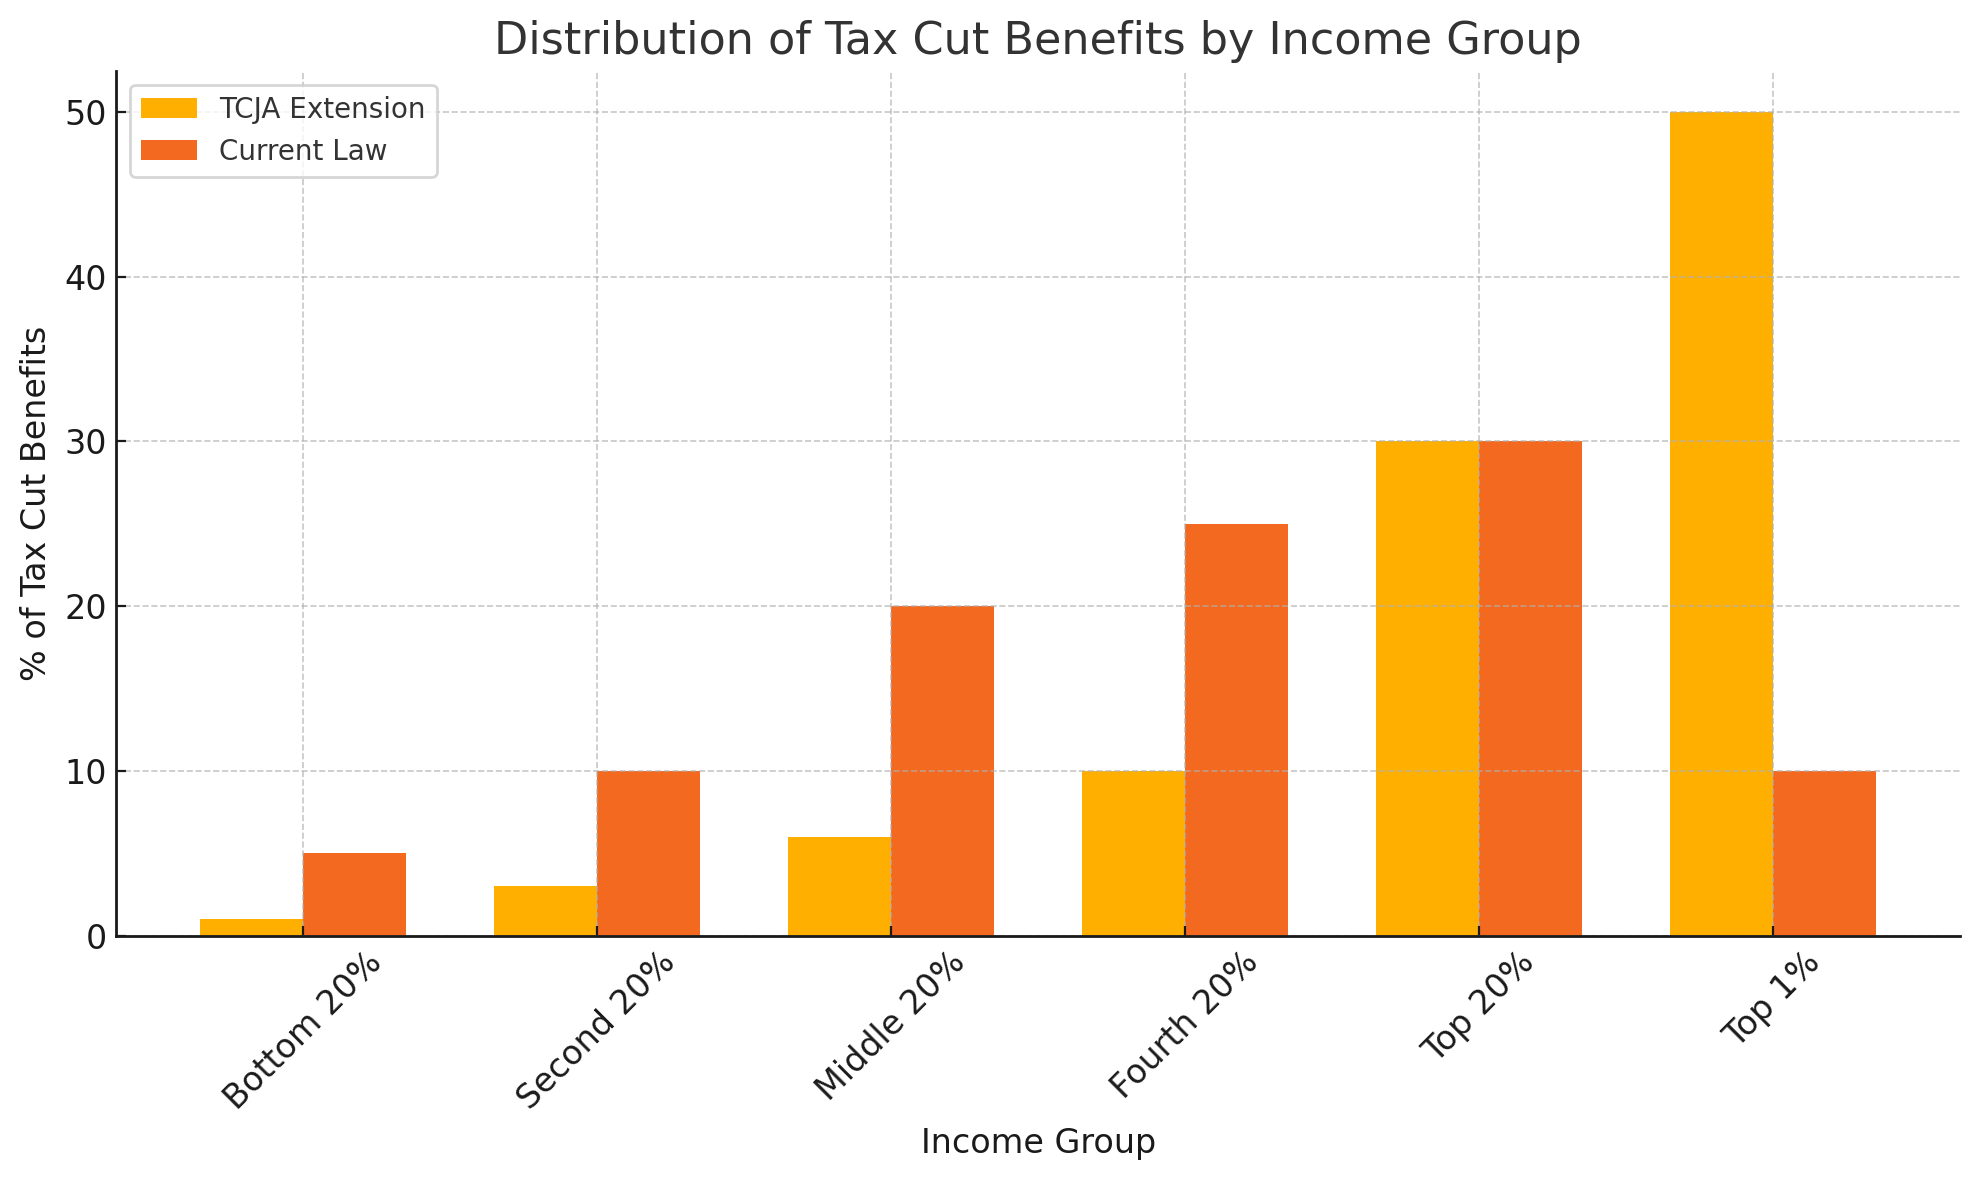
(Chart: Distribution of Tax Cut Benefits Under TCJA Extension vs. Current Law) – A comparison of the share of total tax cut benefits by income group, illustrating that under the resolution’s tax proposals, the top quintile (especially the top 1%) would receive the bulk of benefits, whereas the bottom quintiles see minimal gains. An alternative policy scenario (e.g., extending tax credits for low-income families instead) would show a much more even distribution favoring the middle and bottom.
Medicaid Cuts and Health Care Impact
Resolution Proposal: The budget resolution directs the House Energy and Commerce Committee to identify $880 billion in savings over 10 years in programs under its jurisdiction. While not explicit, such an enormous reduction would almost certainly necessitate major cuts to Medicaid, since Medicaid constitutes the largest share of that committee’s spending jurisdiction. Republican leaders have claimed they do not intend to directly cut Medicaid benefits, suggesting instead crackdowns on “waste, fraud, and abuse” or unspecified efficiencies. However, experts note that it is mathematically impossible to achieve $880 billion in Medicaid savings without fundamentally reducing eligibility, benefits, or provider payments. In effect, the resolution paves the way for the largest Medicaid cuts in U.S. history, potentially by introducing policies like per-capita spending caps or block grants to states, reducing the federal matching funds. Such cuts would have far-reaching implications: Medicaid currently covers around 80 million low-income Americans, including children, people with disabilities, seniors in nursing care, and low-wage workers. Analyses by the Economic Policy Institute (EPI) and others found that the proposed funding reduction would force states to scale back enrollment or benefits, leaving millions of vulnerable people at risk of losing health coverage or facing higher out-of-pocket costs. The resolution’s own authors implicitly acknowledge Medicaid is the target, as no other plausible cuts of that magnitude exist in E&C’s portfolio without touching the program. Notably, Medicaid has proven effective in providing access to care and financial protection; slashing its funding by roughly 15–20% (as $880 billion represents over a decade) would reverse many of those gains. Beyond health outcomes, there are economic ripple effects: states would receive far less federal health funding, potentially leading to job losses in the healthcare sector and greater strain on state budgets if they attempt to backfill the gap.
Importantly, the income distribution consequences of Medicaid cuts are stark. Low-income households would effectively lose income (in the form of health coverage value) – EPI estimates that for the poorest fifth of families, the loss of Medicaid benefits would amount to roughly 7% of their income on average. In tangible terms, cutting Medicaid means many low-income families must spend more of their limited income on medical care or go without care. These losses far outweigh any modest tax cut gains such families might see. Meanwhile, higher-income households are generally unaffected by Medicaid cuts (they do not rely on the program), so they simply keep the tax benefits. This dynamic is why the resolution’s combined tax-and-cut plan is regressive: it takes resources from the poorest (via reduced health benefits) to help pay for tax breaks for the richest.
Beyond income level, demographic groups such as people of color, children, and rural residents would be disproportionately hurt by Medicaid cuts. Due to longstanding inequities, Black and Hispanic Americans are more likely to rely on Medicaid – about 29% of Black and 30% of Hispanic individuals depend on Medicaid for health insurance, compared to roughly 13% of white individuals. This means funding cuts would hit communities of color hardest, widening racial disparities in health coverage. Similarly, over half of all Black and Hispanic children are enrolled in Medicaid or CHIP, so reduced funding threatens health care for millions of kids. Geographically, states with larger low-income and rural populations (for instance, West Virginia or New Mexico) stand to lose the most – estimates suggest that in some heavily Medicaid-dependent states, low-income households could see income losses exceeding 10% if these cuts materialize. In summary, the resolution’s Medicaid cuts would likely increase the number of uninsured Americans, raise uncompensated care burdens on hospitals, and worsen health and financial outcomes for the most vulnerable populations.
Evidence-Based Alternatives – Strengthening Health Coverage and Controlling Costs: Rather than achieving budgetary savings by cutting Medicaid eligibility or services, evidence-based alternatives focus on preserving coverage while addressing health care cost drivers more intelligently:
Payment and Delivery Reforms: A significant body of research points to health system reforms that can slow cost growth without denying coverage. For example, empowering Medicaid (and Medicare) to negotiate prescription drug prices, expanding value-based payment models, and reducing excessive provider payments in certain sectors (like high-cost hospital systems or Medicare Advantage plan overhead) can yield savings. The Inflation Reduction Act of 2022 took steps to lower drug costs in Medicare; similar measures could reduce Medicaid’s costs for medications. Additionally, promoting preventative care and better care coordination in Medicaid can improve health outcomes and potentially reduce expensive emergency care down the line. These strategies address inefficiencies while maintaining benefits for enrollees.
Federal Incentives for State Efficiency, Not Slash-and-Burn Cuts: Instead of a blunt funding cut, the federal government could encourage states to innovate within Medicaid’s framework. For instance, demonstration projects that improve care for high-cost patients (the disabled, chronically ill) have shown promise in controlling expenses. The Affordable Care Act’s Medicaid expansion (which many states adopted) actually reduced uncompensated care costs and improved health metrics; an alternative policy could incentivize the remaining states to expand Medicaid, increasing coverage with the federal government bearing most costs – a contrast to the resolution’s approach of withdrawing support. CBO analyses have suggested that coverage expansions, while costing money upfront, can have long-term fiscal benefits by improving population health and labor productivity.
Protecting Eligibility and Focusing on Long-Term Payoffs: Eligibility restrictions like work requirements (often floated as a way to “trim” Medicaid rolls) have not proven effective in substantially increasing employment, but they do reliably result in eligible people losing coverage due to bureaucratic hurdles. A more evidence-based approach would reject harsh requirements and instead support enrollees through job training or case management outside of the threat of coverage loss. By keeping people insured (especially during economic downturns or personal crises), Medicaid can stabilize families and enable better job retention and productivity. Numerous studies show children who received Medicaid have better health and higher earnings in adulthood, meaning today’s spending is an investment in future economic well-being.
Alternate Sources of Savings/Revenue in Health Care: If deficit reduction in health programs is a goal, policymakers could consider less harmful options, such as reforms to the pharmaceutical patent system (to foster generic competition), anti-fraud measures that actually target improper billing by providers (rather than restricting beneficiaries), or even modest increases in revenue (e.g., slightly higher Medicare taxes on very high earners, as was done to fund Part A in the ACA). These options, supported by policy research from sources like the Medicare Payment Advisory Commission and CBO’s budget options, could generate significant savings without cutting core benefits. In contrast to the resolution’s massive Medicaid cut, these alternatives aim to bend the cost curve while safeguarding the health coverage of low-income Americans.
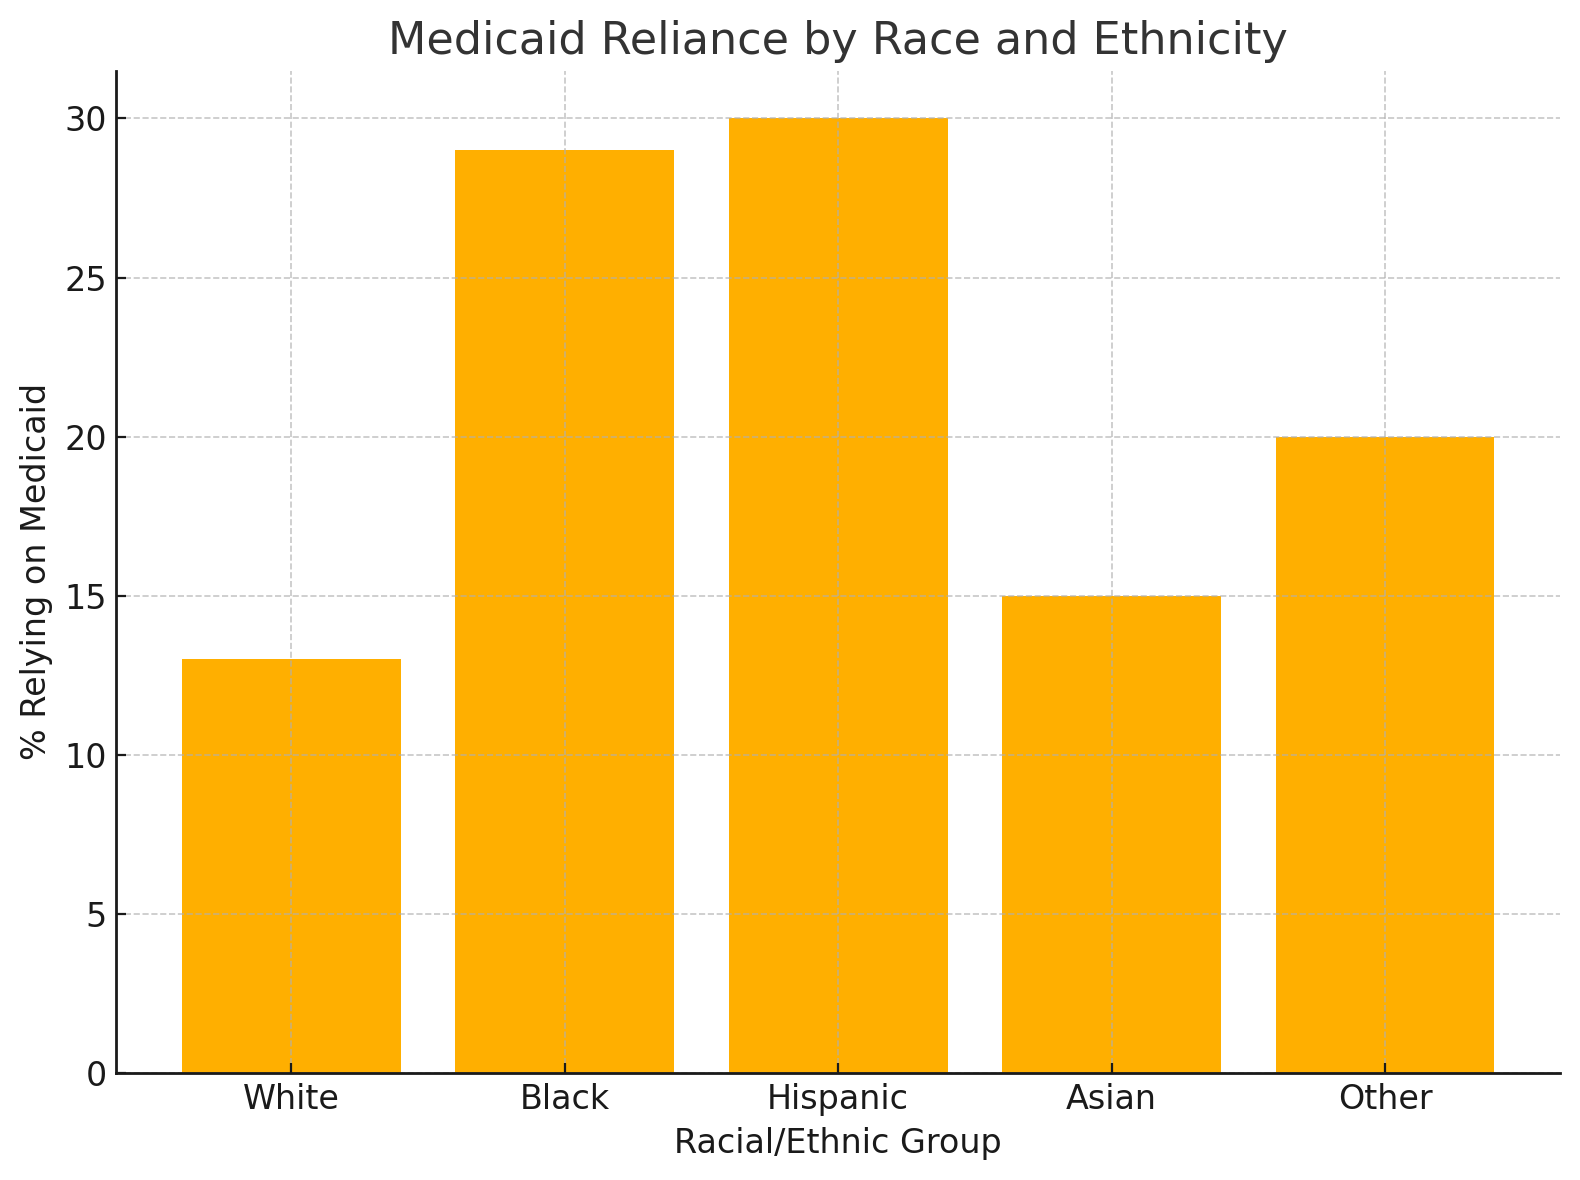
(Chart: Reliance on Medicaid by Race and Ethnicity) – This bar chart shows the share of individuals (and children) on Medicaid or CHIP by racial/ethnic group. It highlights that Black and Hispanic populations have around double the reliance on Medicaid compared to white populations (nearly 30% of Black and Hispanic Americans versus 13% of white Americans). This underscores that large Medicaid cuts would disproportionately affect communities of color.
Chart source: Economic Policy Institute.
Cuts to SNAP and Nutrition Assistance
Resolution Proposal: The House resolution instructs the Agriculture Committee to find $230 billion in savings over the decade, which is widely expected to come from the Supplemental Nutrition Assistance Program (SNAP) and possibly other food aid (such as child nutrition programs). This cut would represent the largest reduction to food assistance programs in U.S. history. SNAP, commonly known as food stamps, currently helps around 42 million Americans (in over 20 million households) afford groceries each month. The proposed cuts – roughly a 30% spending reduction – could be achieved through measures like tightening eligibility criteria, reducing benefit amounts, or shifting costs to states. Any of these would result in fewer people receiving food assistance or smaller benefits for those who do. For example, one scenario modeled by analysts assumed an across-the-board benefit cut; another possibility is imposing stricter work requirements that could particularly push many working-poor adults off the program. The resolution’s supporters argue that such changes would save federal dollars and promote self-sufficiency, but the evidence suggests otherwise: SNAP already has work requirements for able-bodied adults, and the majority of SNAP beneficiaries are children, seniors, or working adults whose earnings are just too low. Cutting SNAP benefits directly reduces the food purchasing power of low-income families, inevitably increasing food insecurity and hardship.
The impact of a $230 billion SNAP cut is not only felt by individual households but also by states and local economies. Currently, SNAP is fully federally funded for benefits (with states only sharing administrative costs). The resolution hints at making states shoulder a portion of benefit costs, a radical change that would strain state budgets and likely lead some states to scale back their programs. Rural communities, in particular, could be hard hit: SNAP participation rates are often high in rural counties, and SNAP dollars stimulate local grocery markets. Research from the USDA indicates that each $1 in SNAP benefits generates about $1.50 to $1.80 in economic activity during a weak economy, as low-income families immediately spend that money on food. Thus, slashing SNAP by such a large amount could even reduce overall economic growth and employment in regions where that spending disappears. From a budget perspective, SNAP is a relatively small part of federal expenditures, but it yields significant returns in reducing poverty and improving nutrition. The proposed cuts would undermine these gains. In terms of who is affected, cuts would disproportionately impact children (who make up roughly half of SNAP recipients) and single-parent households – for instance, a majority of children receiving SNAP live in single-mother families, a group with elevated poverty rates. By raising hurdles to assistance or lowering benefits, the resolution effectively targets some of the most vulnerable Americans, increasing the risk of hunger and associated long-term developmental harms for kids.
Evidence-Based Alternatives – Protecting Nutrition and Fighting Poverty: To support low-income Americans and promote work, research points to strengthening, not weakening, nutrition assistance:
Maintain or Augment SNAP Benefit Levels in Recessions: One alternative approach is to treat SNAP as an automatic stabilizer and ensure its benefits are adequate. During economic downturns or periods of high food inflation, increasing SNAP benefits (as was temporarily done during the COVID-19 pandemic) has proven effective in alleviating hardship and stimulating the economy. CBO analyses consistently find that SNAP increases are one of the most cost-effective stimulus measures. A forward-thinking policy would be to build in benefit adjustments that respond to economic conditions, rather than arbitrary cuts. This would help families put food on the table and soften recessions, benefiting all of society.
Invest in Employment and Training Programs: If the goal is to help SNAP participants achieve self-sufficiency, evidence suggests that supportive employment and training programs (like SNAP E&T or partnerships with job training initiatives) are more effective than punitive measures. An alternative policy could boost funding for voluntary job training and placement services for SNAP recipients who are able to work, thereby improving their earning potential. Simply cutting food aid doesn’t address the underlying barriers to employment (such as lack of skills, childcare, or transportation); a better policy tackles those barriers directly. For example, a program that connects SNAP participants to vocational training and provides childcare assistance could increase employment outcomes without causing hunger.
Strengthen Nutrition Programs with Proven Long-Term Benefits: Far from “wasteful,” nutrition assistance yields long-term payoffs in health and educational attainment. Studies have shown that children with access to SNAP have better health outcomes and even higher incomes in adulthood (compared to similar children without access). Therefore, a budget that prioritizes long-term prosperity would preserve or even expand programs like SNAP and free school meals. One evidence-based option is expanding the Community Eligibility Provision to ensure more low-income schoolchildren receive free meals, which has been linked to improved academic performance. These investments in human capital are modest in cost relative to their benefits. Instead of cutting $230 billion from these programs, policy alternatives could include modest growth caps on other spending that does not directly affect low-income families, or revenue measures as discussed, to achieve deficit reduction without increasing hunger.
State-Federal Partnership Reforms (Without Cost Shifting): If reform of SNAP’s structure is desired, it should not be through cost shifting to states which could lead to program pullback. Instead, federal and state governments can partner to improve outreach (so all eligible families enroll) and program integrity (reducing any payment errors, which are mostly unintentional). The SNAP program already has one of the lowest fraud rates among federal programs. Strengthening administration and technology can further reduce improper payments and ensure benefits go to those who qualify – saving some money without cutting eligibility or benefit levels. This kind of reform, recommended by watchdog agencies, stands in contrast to the resolution’s blunt fiscal target that would likely force people off the program. In summary, evidence-based alternatives for SNAP focus on maintaining adequate assistance, using the program’s flexibility to support work, and recognizing its economic benefits, rather than taking food away from millions of Americans struggling to get by.
Distributional Impacts by Income, Race, Family Type, and Geography
Who Wins and Who Loses under H.Con.Res. 14: Taken together, the tax and spending provisions of the House FY2025 budget resolution would significantly shift resources toward wealthy households at the expense of lower-income Americans. Multiple independent analyses (from the Congressional Budget Office, Economic Policy Institute, Yale University’s Budget Lab, and the Center on Budget and Policy Priorities) converge on this point. Under the plan, high-income individuals and corporations receive substantial tax reductions, while lower-income families face reduced benefits and services. The net effect is regressive. To illustrate, an analysis by Yale’s Budget Lab found that by 2026, the combined policies in the resolution would reduce the after-tax, after-transfer income of the bottom 20% of households by around 5%, on average, whereas households in the top 5% would enjoy about a 3% increase in their income. Middle-income households (around the median) might see a very small gain (roughly 0.5% or less), as modest tax cuts are largely canceled out by the loss of some benefits like healthcare or nutrition support. Essentially, more than 100% of the net fiscal benefit of the resolution’s policies accrues to the top quintile of the population – lower-income groups as a whole are worse off, while upper-income groups are better off.
Looking specifically at the top 1% versus the bottom 40%: those at the very top stand to gain roughly $40,000 or more per year in tax cuts (if TCJA cuts are extended), whereas a low-income family could lose a few hundred to over a thousand dollars in benefits (through cuts to Medicaid, SNAP, and related programs), far outweighing any small tax savings they get. One analysis calculated that the average person in the bottom 20% (annual income under $15,000) would lose about $1,100 per year in net terms, while someone in the top 1% (income above ~$650,000) would gain about $43,000 net. This stark contrast underlines the distributional tilt of the budget: it literally takes income from poor families and gives it to rich families on average. By income group, the second-poorest quintile (incomes up to ~$38,000) would also lose, on net about 1–2% of their income. It’s not until one reaches upper-middle income groups (upper quintiles) that the net effect turns positive, thanks to the sizable tax breaks that outweigh any lost transfers.
From a racial and ethnic equity perspective, the resolution would likely widen gaps. As mentioned earlier, cuts to Medicaid and SNAP disproportionately harm Black and Latino communities (who are overrepresented among beneficiaries due to systemic inequities in income and wealth). Meanwhile, the extended tax cuts disproportionately benefit white and higher-income households (since they are overrepresented among top earners and wealthy owners of capital). The Urban-Brookings Tax Policy Center has shown that the 2017 tax law’s benefits skewed toward white households relative to Black and Latino households and extending those cuts would perpetuate that pattern. When combined with benefit reductions that hit communities of color hardest, the overall effect is that families of color would lose income and security, further increasing racial disparities in poverty rates, health coverage, and wealth.
Differences by family type also emerge. Single-parent families, often headed by women, particularly women of color, would be among the most negatively impacted by cuts to SNAP, Medicaid, and other aid, because these families have higher utilization of those safety nets. For instance, a single mother working a low-wage job might rely on Medicaid for health coverage for herself and her children and use SNAP to help feed her family. Under the resolution, she could see her food benefits cut and potentially face loss of health coverage, while any tax cut (such as a slightly lower income-tax rate) would be trivial in comparison – leaving her family worse off. In contrast, a married couple with a high income might see a notable tax reduction and likely does not rely on safety net programs, so they strictly gain. This dynamic raises concerns about gender and marital status equity, as policies that erode supports for single parents can deepen the challenges these families face.
Geographically, the resolution’s impacts would not be uniform across the country. States with lower incomes and higher reliance on federal aid – many of them in the South and Appalachia, including both “red” and “blue” states – stand to lose the most if Medicaid and SNAP are cut. According to one estimate, each congressional district could lose on average $2 billion in federal Medicaid funding over the next decade, which would be devastating for local healthcare providers and patients. Rural areas, which often have higher enrollment in SNAP and Medicaid (due to higher poverty and older populations), could see significant out-migration or increased poverty as supports are withdrawn. By contrast, wealthier urban and suburban areas (especially those with concentrations of high-income taxpayers) might see more of the tax cut dollars flow to their residents. In sum, the resolution would likely exacerbate regional inequalities: struggling regions lose federal investment, while affluent regions gain windfalls.
Evidence-Based Alternatives – Promoting More Equitable Outcomes: Each of the alternative policies discussed in prior sections would contribute to a more equitable distribution of fiscal benefits and burdens. Here we summarize how a reoriented budget plan could improve the outlook for middle- and lower-income Americans and reduce demographic disparities:
Progressive Fiscal Balance: An alternative budget could combine targeted spending with fair revenue-raising such that the overall impact is either neutral or positive for lower-income groups. For instance, by not extending tax cuts for the wealthy and preserving funding for Medicaid and SNAP, the bottom 40% of households would retain vital resources (health coverage, nutrition, tax credits) that support their standard of living. At the same time, asking the top 1% to contribute a bit more (through taxes or closing loopholes) would have a negligible effect on their very high living standards, but would free up budget room to invest in inclusive growth. The evidence from past bipartisan deficit reduction packages (e.g., the early 1990s) shows that when crafted carefully, deficit reduction can be consistent with poverty reduction – typically by including protections for programs serving low-income populations and focusing adjustments on those most able to absorb them.
Racial Equity Impact Analysis: Incorporating rigorous analysis of racial impact into budget planning is an evidence-based practice increasingly recommended by policy experts. An alternative resolution might explicitly aim to narrow racial gaps in health coverage, income, and wealth. This could involve, for example, expanding Medicaid in holdout states (disproportionately benefiting Black adults in those states), increasing funding for HBCUs or minority-serving institutions as part of education spending, or investing in housing and small business programs targeting historically underserved communities. By contrast, the current resolution’s cuts work in opposition to these goals. Alternatives grounded in research (such as investing in maternal health for women of color, or boosting the Pell Grant for college students) show high returns in reducing disparities. A more equitable budget would protect programs like Medicaid and SNAP because those have documented success in lifting millions of people of color out of poverty each year.
Support for Family Stability: Policies that bolster families – regardless of marital status – can improve economic outcomes. For example, expanding childcare assistance and paid leave (so single parents can work) and enforcing robust child support where possible are pro-family strategies that enjoy bipartisan support in research circles. Instead of cutting programs that single parents rely on, an evidence-led alternative budget would fund initiatives like quality childcare, which yields long-term educational and earnings benefits for children. Such investments help break cycles of poverty and reduce the need for future safety net spending, a win-win for families and fiscal health. This approach recognizes that the well-being of children in single-parent households is crucial for the nation’s future, and that shortchanging their nutrition or health care is counterproductive.
Regional Economic Development: To address geographic imbalances, a better policy mix would include targeted economic development and health interventions in high-poverty areas. For instance, maintaining Medicaid not only provides healthcare but also sustains jobs in rural hospitals; alternatively, offering incentives for physicians to practice in underserved areas (through programs like the National Health Service Corps) could be part of a health budget that boosts rural healthcare access. On the nutrition front, expanding programs like summer meals for children in rural communities helps fill gaps not addressed by SNAP alone. An equitable budget would invest in these areas, whereas the House resolution’s blunt cuts could cause some communities to spiral downward. Experts suggest that place-based investments, such as infrastructure projects or job training in distressed regions, can be paired with the social safety net to revitalize local economies – contrasting sharply with an austerity approach that withdraws support.
In summary, a budget strategy focused on evidence-based alternatives would strive for shared prosperity: ensuring that tax and spending policies do not further enrich the already prosperous at the cost of those struggling, but instead lift up working families, reduce inequality, and create conditions for sustainable growth across all demographic groups.
Fiscal Trajectory and Macroeconomic Considerations
Debt and Deficit Outlook Under the Resolution: While proponents of H.Con.Res. 14 frame it as a path to fiscal responsibility, the actual numbers suggest the resolution could worsen the long-term budget balance. By authorizing $4.5 trillion in tax cuts with only about $1.5–2 trillion in spending cuts, the plan would result in significantly higher deficits and debt relative to current law. The resolution even includes a mechanism (a reserve fund and reconciliation instructions) to raise the debt ceiling by a substantial amount, acknowledging that additional borrowing will occur. The Committee for a Responsible Federal Budget (CRFB) estimated that the initial House budget plan would allow roughly $2.8 trillion in net borrowing over the decade (FY2025–2034) – and that was before the Senate’s even looser version. When accounting for added interest costs, total debt in 2034 could be several trillions higher than under current law. In fact, if all the resolution’s policies were implemented, the U.S. debt-to-GDP ratio is projected to rise much faster: one analysis indicated debt could reach about 130%+ of GDP by 2034 under the plan, compared to roughly 117% if current law (with the scheduled tax expirations) remained in place. This means the resolution is not a traditional austerity budget aimed at lowering deficits; rather, it prioritizes tax cuts and relies on optimistic assumptions or unspecified cuts to make the numbers appear to improve.
The reliance on unspecified future cuts is a known budget gimmick. The resolution calls for an extra $2 trillion in deficit reduction that is not tied to any committee, essentially a placeholder that future Congresses would have to fill in. Fiscal experts are skeptical that such large unspecified cuts (on top of the Medicaid and SNAP cuts) would ever materialize, especially since they could imply politically sensitive reductions in Medicare or Social Security if pursued. Absent those unrealized savings, the likely outcome is higher deficits. The economic impact of significantly higher federal debt cannot be ignored: over time, rising debt can lead to higher interest payments (squeezing out other spending), reduced national savings, and greater vulnerability to interest rate increases. Indeed, CBO warns that on the current trajectory, interest costs will be one of the fastest-growing parts of the budget. The resolution, by extending tax cuts without fully paying for them, would accelerate this trend.
Another macroeconomic consideration is the effect of the combined fiscal changes on growth and inflation. In the short run, tax cuts provide some fiscal stimulus (which could be mildly inflationary if the economy is at full employment, as it has been in 2025), whereas spending cuts provide fiscal contraction. The mix proposed – large tax cuts and large entitlement cuts – might somewhat offset each other in terms of demand. However, because high-income tax cuts have a lower multiplier (rich households save more of their tax windfall) and low-income spending cuts have a higher multiplier (poor households must cut consumption of essentials), the net result could be a drag on economic growth, especially in the near term. In the longer term, as discussed, the debt buildup from the tax cuts could crowd out private investment, leading to lower productivity and GDP than otherwise. There is a consensus among many economists that merely cutting taxes does not pay for itself through growth; on the contrary, unpaid-for tax cuts can reduce growth in the long run due to debt effects. The resolution’s fiscal trajectory might thus undermine the very goal of boosting sustainable economic growth.
Evidence-Based Alternatives – Responsible Fiscal Strategy: Crafting a budget that supports lower-income Americans and maintains a healthier fiscal outlook is challenging but feasible with a balanced approach:
Balanced Deficit Reduction: Historical experience (such as the bipartisan deficit deals in the 1980s and 1990s, and the Budget Control Act of 2011) demonstrates that the most durable way to improve the fiscal trajectory is a mix of revenue increases and targeted spending restraint, rather than lopsided cuts or tax breaks. An evidence-based alternative fiscal plan for FY2025 could aim for a more modest debt path by, for example, letting tax rates on upper incomes return to previous levels (raising revenue) and slowing the growth of health care costs system-wide (bending the curve, as discussed, rather than cutting people off programs). The result could be deficit reduction that doesn’t hit low-income Americans hardest. CBO’s menu of options to reduce the deficit includes many items that ask for sacrifice from broader groups (such as reducing farm subsidies or increasing user fees for certain services) which would be less harmful than concentrating cuts on anti-poverty programs.
Realistic Economic Assumptions and Gimmick-Free Budgeting: An alternative approach would avoid the accounting gimmicks seen in H.Con.Res. 14 (like pretending $3.8 trillion of tax cuts have “no cost” by using a current-policy baseline). Instead, it would explicitly acknowledge trade-offs and ensure policy changes are fully paid for or justified. For instance, if extending some middle-class tax relief is deemed important, the alternative plan would pair it with offsetting measures (like closing a corporate tax loophole or implementing a new efficiency in Medicare spending) so that the net effect on debt is neutral. This honest budgeting builds credibility and prevents future fiscal cliffs. The evidence from fiscal consolidations abroad also suggests that transparent plans (where people see how debt will be contained) can bolster economic confidence more than optimistic forecasts built on vague promises.
Public Investment for Growth: One critique of pure austerity is that it can undermine growth by cutting productive investments. A forward-looking budget would prioritize critical investments (infrastructure, R&D, education) that expand the economy’s capacity, while finding savings in areas that do not harm growth potential. For example, maintaining funding for early childhood education or job training yields high returns by improving workforce skills, which can increase GDP and revenues in the long run. The alternative to the resolution would thus not indiscriminately cut discretionary spending or investments that benefit the middle class (like Pell Grants or infrastructure grants). Instead, it could reallocate funds towards those high-return areas. This growth-friendly strategy can help the debt-to-GDP ratio by boosting GDP as well as addressing needs, a point often made by economists: the composition of deficit reduction matters for its effect on growth.
Safeguarding Automatic Stabilizers: Another aspect of a responsible fiscal approach is to preserve the automatic stabilizer functions of the budget (like unemployment insurance, SNAP, Medicaid) so that in the event of a recession, these programs can cushion the blow. The House resolution’s large cuts would impair those stabilizers. An evidence-based budget plan would explicitly avoid caps or cuts that prevent these programs from responding to need. By doing so, it ensures that if the economy hits a downturn, deficits will temporarily expand to soften the recession – which is a feature, not a bug, of fiscal policy. Then, in good times, the focus can return to trimming deficits. Many economists advocate for this countercyclical approach. In practice, this could mean setting deficit targets that adjust for the economic cycle (structural vs cyclical deficit) rather than rigidly cutting programs regardless of economic conditions.
In conclusion, a more prudent fiscal trajectory is attainable through balanced choices that do not sacrifice the well-being of middle- and lower-income Americans. The evidence strongly indicates that investing in people and asking for equitable contributions to deficit reduction yields better economic and social outcomes than the approach taken in H.Con.Res. 14. By following research-backed alternatives, policymakers could support economic growth, reduce inequality, and still address long-run fiscal challenges – a truly sustainable path for the nation’s budget.
References
Economic Policy Institute (April 2025). Analysis of House FY2025 Budget Resolution (H.Con.Res. 14) – Distributional Impacts. (Includes data on income quintile impacts and racial disparities in Medicaid reliance.)
Economic Policy Institute – Josh Bivens et al. (Feb 28, 2025). “Cutting Medicaid to pay for low taxes on the rich is a terrible trade for American families.” EPI Report. (Findings: Bottom quintile would lose ~7.4% of income from Medicaid cuts, gain only 0.6% from tax cuts; top 1% gains ~3.9%. Highlights racial impact of Medicaid cuts.)
House Budget Committee Resolution Text, H.Con.Res. 14 (119th Congress, 2025). (Primary source detailing the $4.5 trillion tax cut instructions and $1.5 trillion spending cut instructions over 2025–2034.)
Congressional Budget Office (various reports and analyses, 2018–2024). (Long-run effects of deficit-financed tax cuts on economic growth; budget options for reducing deficits; distribution of federal taxes and transfers by income.)
Joint Committee on Taxation (2017, 2023). (Distribution tables for the TCJA and its extension, showing the majority of benefits accruing to upper income households; revenue estimates for extending expiring tax provisions.)
Center on Budget and Policy Priorities – Brendan Duke (March 19, 2025). “New Analysis Quantifies Low- and Moderate-Income Families’ Losses Under House Budget Resolution.” CBPP Blog. (Uses Yale Budget Lab data: bottom 20% lose 5% income net; second 20% lose 1.4%; top 1% gain ~2.9%. Explains impact on low-income families and why bottom 40% end up worse off.)
Yale University Budget Lab (March 2025). Analysis of House FY2025 Budget Framework. (Modelled the combined effect of a 30% SNAP cut, 15% Medicaid cut, and permanent TCJA extension: concluded that over 100% of net benefits go to top 20%.)
Center for American Progress Action – Estep, Murphy, Ducas, Gee, Baker (Feb 25, 2025). “Republican House Budget’s $880 Billion Medicaid Cut by Congressional District.” (Estimated impacts by district: on average ~$2 billion less per district over 10 years, nearly 730,000 people could lose coverage nationwide. Discusses likely mechanisms like work requirements or FMAP reductions.)
Committee for a Responsible Federal Budget (April 2025). “Analysis of Senate and House FY 2025 Budget Resolutions.” (Findings: House resolution would allow ~$2.8 trillion in net deficit increases over decade; if fully realized, debt could rise to ~134% of GDP by 2034 vs 117% under current law. Critiques use of current-policy baseline to mask costs.)
Economic Policy Institute – Adewale Maye (April 2025). “Medicaid cuts will disproportionately hurt people of color and children.” EPI Blog. (Provides statistics on Medicaid reliance: ~29% of Black and 30% of Hispanic Americans on Medicaid vs 13% of white Americans; over half of Black/Hispanic children on Medicaid/CHIP. Explains how Medicaid expansion reduced racial uninsured gaps and how cuts would reverse progress.)
USDA Economic Research Service & Food and Nutrition Service data (2019–2022). (SNAP multipliers: every $1 SNAP = $1.50–$1.80 in GDP in a weak economy; profile of SNAP recipients: high share of children, seniors, and working poor; SNAP error rates and efficiency.)
Moody’s Analytics – Mark Zandi (2020). (Macroeconomic multipliers for fiscal policy: tax cuts for high incomes have lower multiplier (~0.3–0.6) vs SNAP or UI benefits (~1.5+). Supports argument that cutting low-income support hurts aggregate demand more than equivalent dollar cuts elsewhere.)
Urban-Brookings Tax Policy Center (2021, 2023). (Distributional analysis of TCJA impacts by income and race; projections of extending TCJA benefits by income percentile, showing top-heavy distribution. Also analysis showing minimal growth from TCJA relative to cost.)
National Women’s Law Center Memo (April 2025). “Inaccuracies in Claims About Budget’s Medicaid Cuts.” (Points out that claims of saving Medicaid money via fraud elimination are overstated; nearly impossible to achieve $880B cut without cutting coverage for ~15 million people. Notes that Medicaid covers many women, including prenatal and maternal health.)
Center on Budget and Policy Priorities – Chuck Marr & Samantha Jacoby (Feb 2025). “House Republican Budget’s $4.5 Trillion Tax Cut Doubles Down on Costly Failures of 2017 Tax Law.” (Argues extension largely benefits the wealthy, failed to deliver promised investment boom, and will increase deficits; recommends alternative tax approaches.)
Coalition on Human Needs (April 3, 2025). “House Budget Proposal Hurts Millions of People to Pay for Tax Cuts.” (Advocacy perspective summarizing impacts: $2 trillion cuts to vital services, including Medicaid and SNAP, to finance $4.5 trillion tax cuts. Emphasizes human cost for low-income families, rural communities, etc.)
Tax Policy Center / U.S. Treasury distribution reports (2023). (Show that top 20% of households receive roughly 65% of the benefits of TCJA extension, while bottom 20% receive under 2%. Treasury analysis confirms top 1% benefit the most in dollar terms.)
Penn Wharton Budget Model (2023). (Analysis of TCJA extension: projects additional deficits and slight increase in GDP in short term but higher debt ratio long term; distribution tables showing gains concentrated at top. Useful for comparing against alternative tax credit expansions which PWBM finds can be more progressive.)
Kaiser Family Foundation – Medicaid research (2022–2024). (Effects of Medicaid expansion on coverage and outcomes; potential impact of capped funding. KFF reports that a $880B cut might represent roughly 20% of federal Medicaid spending, forcing states to reduce enrollment or benefits significantly. Also KFF data on who is covered by Medicaid – e.g., majority of nursing home residents, etc.)
U.S. Department of Agriculture, “Reaching Those in Need” (annual SNAP participation report). (Highlights importance of SNAP for families with children and the elderly; details on single-parent households’ SNAP usage. Supports statements on how cuts would affect those populations.)
This is a companion discussion topic for the original entry at https://uncommongathering.substack.com/p/analysis-of-house-concurrent-resolution